Urban Heat Island (UHI)
June 21, 2022 2022-09-15 0:09Urban Heat Island (UHI)
Urban Heat Island (UHI)
Introduction
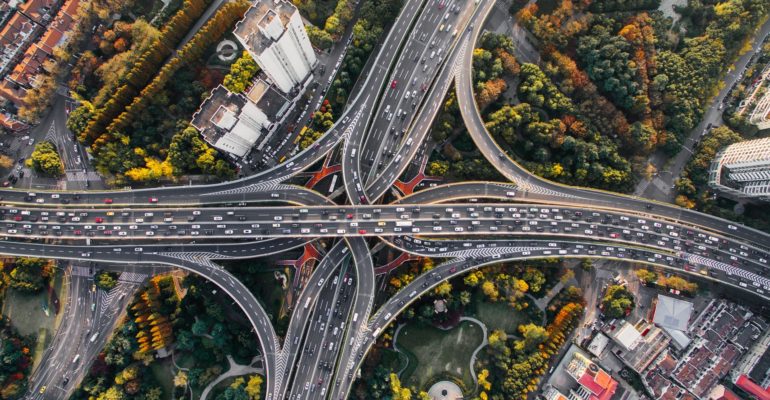
The world’s major cities are experiencing a significant increase in temperature when contrasted to their surrounding region. Recent studies have found that the cause of this phenomena is the conversion of natural surfaces with low thermal inertia, such as greenery, to man-made structures with high thermal inertia, such as roadways and concrete buildings. This phenomenon is known as “Urban Heat Island,” and remote sensing and GIS have been found to be important techniques for studying it. Urban Heat Island is a result of a) urbanisation and (b) anthropogenic growth. The first is to adjust the land cover as urbanisation erases the natural ground by substituting non-porous built-up surfaces for the natural surface content. The second is due to shipping and manufacturing activities resulting in a shift in the equilibrium of ambient surface energy by trap, incoming solar radiation during the day and reradiation at night. UHI is recognised as an issue that arises as a consequence of urban areas’ uncontrolled development.
UHI can usually be represented by air temperature and it is simple to obtain LST from remotely sensed images. The relationship between Land surface temperature (LST) and Land use and Land cover (LULC) can be demonstrated by remotely sensed data. In order to perform the UHI analysis, Landsat data was commonly used. The association between LULC and LST greatly helps to assess the effects of the transition in LULC on the LST and Normalized Difference Vegetation Index (NDVI) is a parameter that has a direct impact on the study of UHI. Based on the above relationship between LST and NDVI, due to the difference in NDVI between various LULC forms, the LULC shift would indirectly influence the LST..
Case Study
A Research is being conducted on a region of the Chennai city in India to show the spatial and temporal pattern and changes of urban heat island (UHI). Landsat 7 and 8 Imageries of 2000, 2010 and 2020, whose spatial resolution sufficient for some significant environmental parameters to be calculated. LST values were extracted from Landsat 7 ETM+ (2000,2010) and Landsat 8 OLI (2020). A Normalized Difference Vegetation Index (NDVI), Normalized Difference Built-up Index (NDBI) maps was extracted from the same image.
The thermal data were corrected and converted to top of the atmosphere radiance values and further to temperature in degrees Celsius from Kelvin scale using ArcGIS. Four land use and land cover (LULC) types (Vegetation, Barren land, built-up area and water) were classified from the Landsat images by supervised classification techniques using maximum likelihood classification (MLC) algorithm. LULC, NDVI, NDBI, LST maps have been prepared using ArcGIS 10.8.
Result shown that during the investigation period (2000-2020), high temperatures were typically experienced mostly in concentrated built-up areas with lower concentrated temperatures in vegetation areas. From the results, it is clear that the values of land surface temperature had a positive correlation with NDBI and a negative correlation with NDVI.
This research can be a data source for urban planners, designers, scientists, engineers, demographers and other social scientists to improve the quality of the environment by designing green lands, changing the surface cover and developing guidelines for urban design, as well as making decisions that will improve sustainability methods in the environment.
Solutions to Urban Heat Island
Some of the recommendation to reduce Urban Heat Island:
- Light-colored concrete and white roofs have to be used.
- Tree Planting in Cities
- Vegetation Cover and Green Roofs
- Green revolution have to properly implemented in the city
- lots of Green parking within the city have to build.
- Implementing smart growth strategies
- Passive Cooling and Climate Responsive Architecture
- Reducing Anthropogenic Heat within the city
- Healthy and Heat-Resilient Development
- Heat Mitigation Policies and Rules have to be Implement in the city
Abbreviation:
Landsat: The Landsat Program is a collection of Earth-observing satellite missions administered cooperatively by NASA and the United States Geological Survey. Landsat satellites provide the best ground resolution and spectral bands for tracking land use and documenting land change caused by climate change, urbanisation, drought, wildfires, biomass changes (carbon assessments), and a variety of other natural and human-induced changes.
LST: Land Surface Temperature is the temperature of the land surface’s radiative skin recorded in the direction of the distant sensor. It is calculated using Top-of-Atmosphere brightness temperatures from the infrared spectral channels of a geostationary satellite system. It’s been used to investigate the effects of land cover changes on climate.
NDVI: Normalized Difference Vegetation Index is particularly valuable for continental- to global-scale vegetation monitoring, because it can correct for changing lighting conditions, surface slope, and viewing angle. NDVI, on the other hand, tends to saturate over thick vegetation and is sensitive to underlying soil colour.
NDBI: Normalized Difference Built-up Index is useful for mapping urbanised regions. Remote sensing imagery can give immediate and synoptic views of urban land cover, which is important for monitoring the geographical distribution and expansion of urban built-up regions.
LULC: Land Use / Land Cover is the categorization or classification of human activities and natural features on the landscape across time using recognised scientific and statistical methods of analysis of acceptable source materials.

